 16/17 Statistics in summary
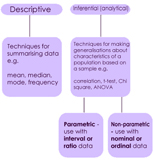
The picture depicts a diagram of the two approaches to summarise descriptive data.
The left hand side shows the title of 'descriptive' and explains it as techniques for analysing such data such as mean, medium, mode and frequency
The right hand side show the title of 'inferential (analytical) and explains the techniques for analysing such data as techniques for making generalisations about characteristics of a population based on a sample - significance testing. Examples would be correlation, t-test, chi square and ANOVA
From the 'inferential' square are two following branches. The first is parametric, to be used with interval or ratio data
The second is non-parametric, to be used with ordinal or nominal data
The following shows how they correspond e.g. a type of data can be nominal, it would be measured as an average of mode or as a spread of verbal descriptions only.
Type of data - nominal
Measures of central tendency - average - mode
Measure of dispersion - spread - verbal descriptions only
Type of data - ordinal
Measures of central tendency - average - mode and median
Measure of dispersion - spread - range
Type of data - interval/ratio
Measures of central tendency - average - mode, median and mean
Measure of dispersion - spread - Statistical measures of deviation, esp standard deviation
Inferential statistical analysis resources can be found here:
![]()
![]()