16/19 Using SPSS
Statistical analysis exercises
Using the SPSS data file provided you may like to try some of the following statistical analysis:
Task 1 - Frequency tables (Analyse>Descriptive statistics>Frequencies)
Using Frequency analysis, answer the following:
a) What percentage of participants are:
- male?
- female?
b) What percentage of participants have:
- no IR experience?
- some IR experience?
- lots of IR experience?
c) What percentage of the participants were generally satisfied overall with the search system?

Task 1 - Frequency tables
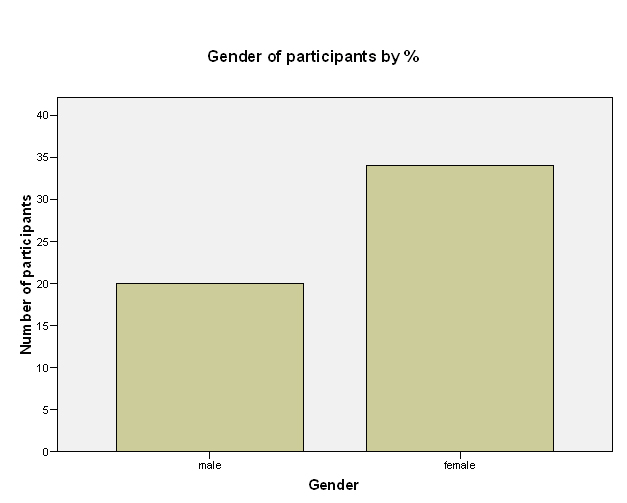
a) Gender of respondent
| Frequency | Percent | Valid Percent | Cumulative Percent | ||
|---|---|---|---|---|---|
| Valid | male | 20 | 37.0 | 37.0 | 37.0 |
| female | 34 | 63.0 | 63.0 | 100.0 | |
| Total | 54 | 100.0 | 100.0 | ||
So, 20 of the participants, or 37%, were male and 34, or 63%, were female
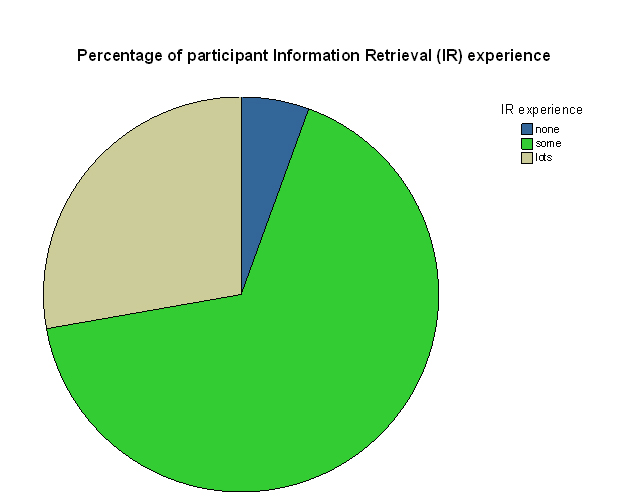
b) IR experience
| Frequency | Percent | Valid Percent | Cumulative Percent | ||
|---|---|---|---|---|---|
| Valid | none | 3 | 5.6 | 5.6 | 5.6 |
| some | 36 | 66.7 | 66.7 | 72.2 | |
| lots | 15 | 27.8 | 27.8 | 100.0 | |
| Total | 54 | 100.0 | 100.0 | ||
So, 3 participants, or 5.6%, had no IR (Information Retrieval) experience, 36, or 66.7%, had some IR experience and 15, or 27.8%, had lots of IR experience
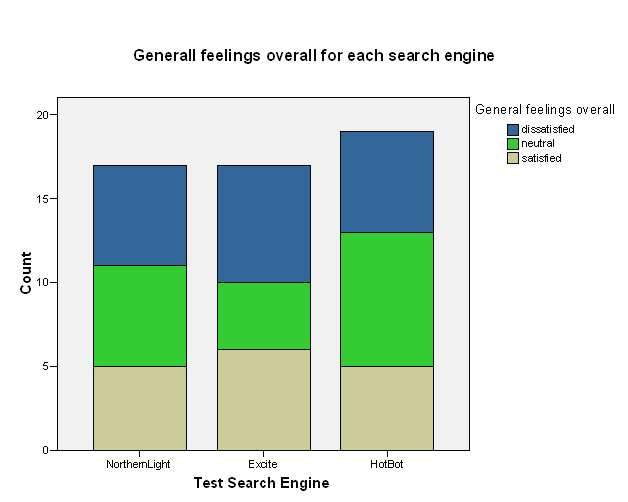
c) General feelings overall
| Frequency | Percent | Valid Percent | Cumulative Percent | ||
|---|---|---|---|---|---|
| Valid | dissatisfied | 19 | 35.2 | 35.8 | 35.8 |
| neutral | 18 | 33.3 | 34.0 | 69.8 | |
| satisfied | 16 | 29.6 | 30.2 | 100.0 | |
| Total | 53 | 98.1 | 100.0 | ||
| Missing | missing | 1 | 1.9 | ||
| Total | 54 | 100.0 | |||
Here, some participants choose not to answer this question, so we use the column labelled 'Valid Percentage'. So, 16 participants, or 30.2%, were satisfied overall.
Task 2 - Graphs
Using the Graphs option create:
a) A simple bar chart showing Gender of the sample by percentage
b) A pie chart showing IR experience by percentage
c) A stacked bar chart by General Feelings Overall and SE, by count
Task 2 - Graphs
Click on each image to show a larger version; click anywhere to close and return to this page
a)
b)
c)
Task 3 - Cross-tabulations (Analyse>Descriptive statistics>Cross-tabs)
Cross-tabulations can be used to show if there is a relationship between variables.
Use Cross-tabulations to answer the following:
a) 16 participants responded that they were Generally Satisfied with the search system overall. Are these participants more likely to be satisfied or dissatisfied with the Effectiveness of the search system? (Cross-tabulate General Feelings Overall and Effectiveness).
b) 16 participants responded that they were Generally Satisfied with the search system overall. Are these participants more likely to be satisfied or dissatisfied with the Efficiency of the search system? (Cross-tabulate General Feelings Overall and Efficiency).
c) 19 respondents thought the search system to be Ineffective. Are these more likely to view the system as Efficient or Inefficient? (Cross-tabulate Effectiveness with Efficiency).
Task 3 - Cross-tabulations
a) General feelings overall * Effectiveness Crosstabulation
Count
| Effectiveness | |||||
| ineffective | neutral | effective | Total | ||
|---|---|---|---|---|---|
| General feelings overall | |||||
| dissatisfied | 17 | 2 | 0 | 19 | |
| neutral | 5 | 9 | 4 | 18 | |
| satisfied | 1 | 3 | 12 | 16 | |
| Total | 23 | 14 | 16 | 53 | |
So, of the 16 participants, or 30.2%, who were Generally Satisfied Overall, 12 thought the system Effective and 3 had a neutral view and 1 thought the system inefficient. Therefore, Satisfied participants were more likely to view the system as Effective.
Those who were Dissatisfied (19)were more likely to view the system as Ineffective (17 thought it Ineffective, 2 were neutral).
b) General feelings overall * Efficiency Crosstabulation
Count
| Efficiency | |||||
| inefficient | neutral | efficient | Total | ||
|---|---|---|---|---|---|
| General feelings overall | |||||
| dissatisfied | 15 | 4 | 0 | 19 | |
| neutral | 2 | 10 | 6 | 18 | |
| satisfied | 0 | 2 | 14 | 16 | |
| Total | 17 | 16 | 20 | 53 | |
So, of the 16 participants, or 30.2%, who were Generally Satisfied Overall, 14 thought the system Efficient and 2 had a neutral view. Therefore, Satisfied participants were more likely to view the system as Efficient.
Those who were Dissatisfied (19) were more likely to view the system as Inefficient (15 thought it Inefficient, 4 were neutral).
c) Effectiveness * Efficiency Crosstabulation
Count
| Efficiency | ||||||
| inefficient | neutral | efficient | Total | |||
|---|---|---|---|---|---|---|
| Effectiveness | ineffective | 14 | 7 | 2 | 23 | |
| neutral | 2 | 6 | 6 | 14 | ||
| effective | 1 | 3 | 13 | 17 | ||
| Total | 17 | 16 | 21 | 54 | ||
So, of the 17 participants, or 31.5%, who thought the system Inefficient, 14 thought the system Ineffective, 2 had a neutral view and 1 thought it Effective. Therefore, participants who viewed the system as Inefficient were more likely to view the system as Ineffective.
Those who thought the system Efficient (21) were more likely to view the system as Effective (13 thought it Effective , 6 were neutral and 2 thought it Ineffective ).
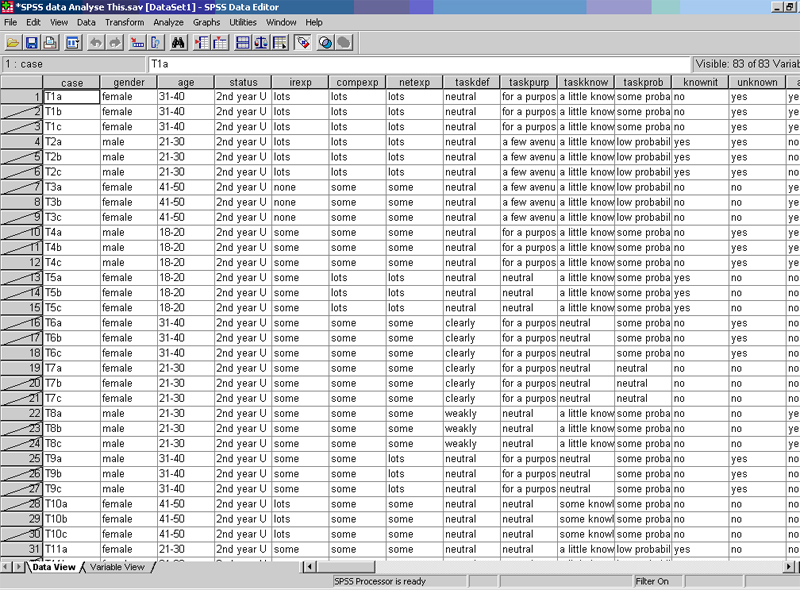
Task 4 - Selecting cases (Data>Select cases)
So far you have analysed the data globally and have started to develop an understanding of participants' responses across all three of the SEs. Now you will work with the responses for each SE individually.
Firstly, select Data from the top menu bar and click on Select cases. Select the second option If the condition is satisfied and click on the box If . Scroll down the variables list until you get to Test Search Engine, click on this and move it across to the working box. The click on the = sign and then 1, click on Continue and then OK . You have now selected cases using Northern Light. Now run some analysis to answer the following questions:
a) 5 participants responded that they were Generally Satisfied with the search system overall. Are these participants more likely to be satisfied or dissatisfied with the Effectiveness of the search system?
b) 5 participants responded that they were Generally Satisfied with the search system overall. Are these participants more likely to be satisfied or dissatisfied with the Efficiency of the search system?
c) 7 respondents thought the search system to be Ineffective. Are these more likely to view the system as Efficient or Inefficient?
Repeat this for the other two SEs. Compare your results across all three SEs and globally.
Task 4 - Select cases
When you have run 'Select Cases' your Data View should look like this:
a) General feelings overall *Effectiveness Crosstabulation
| Effectiveness | ||||||
| ineffective | neutral | effective | Total | |||
|---|---|---|---|---|---|---|
| General feelings overall | dissatisfied | 5 | 1 | 0 | 6 | |
| neutral | 2 | 3 | 1 | 6 | ||
| satisfied | 0 | 1 | 4 | 5 | ||
| Total | 7 | 5 | 5 | 17 | ||
So, of the 5 participants, or 29.4%, who were Generally Satisfied Overall, 4 thought the system Effective and 1 had a neutral view. Therefore, Satisfied participants were more likely to view the system as Effective.
Those who were Dissatisfied (6) were more likely to view the system as Ineffective (5 thought it Ineffective, 2 were neutral).
b) General feelings overall *Efficiency Crosstabulation
| Efficiency | ||||||
| inefficient | neutral | efficient | Total | |||
|---|---|---|---|---|---|---|
| General feelings overall | dissatisfied | 6 | 0 | 0 | 6 | |
| neutral | 1 | 3 | 2 | 6 | ||
| satisfied | 0 | 1 | 4 | 5 | ||
| Total | 7 | 4 | 6 | 17 | ||
So, of the 5 participants, or 29.4%, who were Generally Satisfied Overall, 4 thought the system Efficient and 1 had a Neutral view. Therefore, Satisfied participants were more likely to view the system as Efficient.
Those who were Dissatisfied (6) were more likely to view the system as Ineffective (6 thought it Ineffective).
Count
| Efficiency | ||||||
| inefficient | neutral | efficient | Total | |||
|---|---|---|---|---|---|---|
| Effectiveness | ineffective | 6 | 1 | 0 | 7 | |
| neutral | 1 | 1 | 3 | 5 | ||
| effective | 0 | 2 | 4 | 6 | ||
| Total | 7 | 4 | 7 | 18 | ||
So, of the 7 participants, or 38.9%, who thought the system Inefficient, 6 thought the system Ineffective and 1 had a neutral view. Therefore, participants who viewed the system as Inefficient were more likely to view the system as Ineffective.
Those who thought the system Efficient (7) were more likely to view the system as Effective (4 thought it Efficient and 3 were neutral).
Task 5 - Correlations (Analyse>Correlate>Bivariate>Spearman's)
Having identified that relationship's exist between General Feelings Overall and Effectiveness and Efficiency you can now go on to see if these are statistically significant.
Task 5 - Correlations
a) Correlations
| General feelings overall | Efficiency | |||
|---|---|---|---|---|
| Spearman's rho | General feelings overall | Correlation Coefficient | 1.000 | .779(**) |
| Sig. (2-tailed) | . | .000 | ||
| N | 17 | 17 | ||
| Efficiency | Correlation Coefficient | .779(**) | 1.000 | |
| Sig. (2-tailed) | .000 | . | ||
| N | 17 | 18 |
** Correlation is significant at the 0.01 level (2-tailed).
So, SPSS is indicating that a statistically significant relationship exists between a participant's General Satisfaction Overall and their view of the Effectiveness of the system.
b)Correlations
| General feelings overall | Efficiency | |||
|---|---|---|---|---|
| Spearman's rho | General feelings overall | Correlation Coefficient | 1.000 | .843(**) |
| Sig. (2-tailed) | . | .000 | ||
| N | 17 | 17 | ||
| Efficiency | Correlation Coefficient | .843(**) | 1.000 | |
| Sig. (2-tailed) | .000 | . | ||
| N | 17 | 18 |
** Correlation is significant at the 0.01 level (2-tailed).
So, SPSS is indicating that a statistically significant relationship exists between a participant's General Satisfaction Overall and their view of the Efficiency of the system.
c) Correlations
| General feelings overall | Efficiency | |||
|---|---|---|---|---|
| Spearman's rho | General feelings overall | Correlation Coefficient | 1.000 | .748(**) |
| Sig. (2-tailed) | . | .000 | ||
| N | 18 | 18 | ||
| Efficiency | Correlation Coefficient | .748(**) | 1.000 | |
| Sig. (2-tailed) | .000 | . | ||
| N | 18 | 18 |
** Correlation is significant at the 0.01 level (2-tailed).
So, SPSS is indicating that a statistically significant relationship exists between a participant's view of the Effectiveness of the system and their view of the Efficiency of the system.
![]()
![]()