13/19 Using SPSS
Missing values in SPSS
How you choose to deal with questions participants decide not to answer will affect the results of your statistical analysis.
It is common to define '99' as a missing value, i.e. a respondent has failed to answer a question. Once you have done this you have two options as to how to deal with missing values:
1) No missing values and,
2) Discrete missing values.
Coding Missing Values
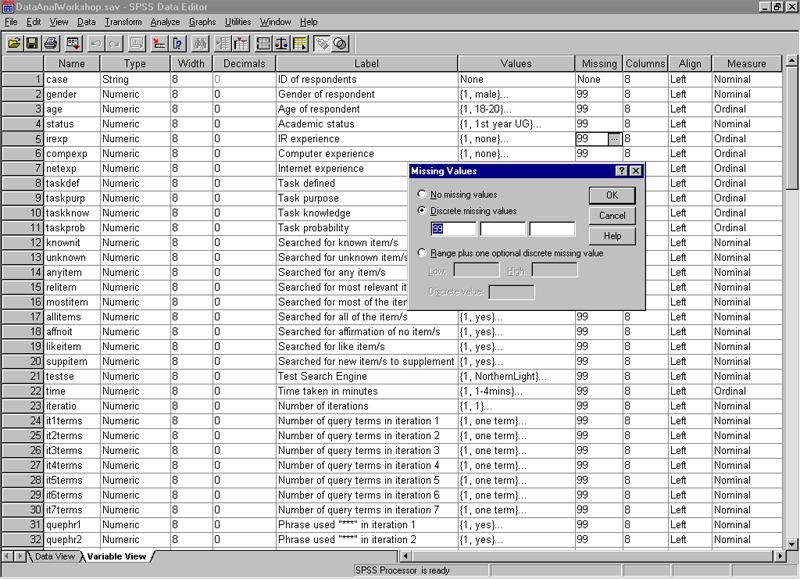
No Missing Values
SPSS will default to this option.
When you generate statistics in SPSS the cases that were coded as a non-response will be treated as a valid response , e.g.
Time taken in minutes
| Frequency | Percent | Valid Percent | ||
|---|---|---|---|---|
| Valid | 1-4mins | 1 | 2.2 | 2.2 |
| 5-9mins | 9 | 20.0 | 20.0 | |
| 10-14mins | 6 | 13.3 | 13.3 | |
| 15-19mins | 11 | 24.4 | 24.4 | |
| 20-24mins | 4 | 8.9 | 8.9 | |
| 25-29mins | 3 | 6.7 | 6.7 | |
| 30-34mins | 2 | 4.4 | 4.4 | |
| 55-59mins | 1 | 2.2 | 2.2 | |
| 60-65mins | 2 | 4.4 | 4.4 | |
| Missing | 6 | 13.3 | 13.3 | |
| Total | 45 | 100.0 | 100.0 |
So, here 6 participants did not answer this question, so the total number of participants was not 45, but 39. However, the frequency is still calculated using 45 participants.
If we look at how many participants searched for between 5-9 minutes we can see that 9 people searched for this length of time. If we want to look at that as a percentage of the sample, SPSS has calculated it as 9 ÷ 45 x 100 = 20%.
Compare this to how SPSS calculates this when Missing Values are declared as below.
Discrete Missing Values
If you declare that a value is missing SPSS will omit the values from analysis, presenting you with Valid Percentages, e.g.
Time taken in minutes
| Frequency | Percent | Valid Percent | ||
|---|---|---|---|---|
| Valid | 1-4mins | 1 | 2.2 | 2.6 |
| 5-9mins | 9 | 20.0 | 23.1 | |
| 10-14mins | 6 | 13.3 | 15.4 | |
| 15-19mins | 11 | 24.4 | 28.2 | |
| 20-24mins | 4 | 8.9 | 10.3 | |
| 25-29mins | 3 | 6.7 | 7.7 | |
| 30-34mins | 2 | 4.4 | 5.1 | |
| 55-59mins | 1 | 2.2 | 2.6 | |
| 60-65mins | 2 | 4.4 | 5.1 | |
| Total | 39 | 86.7 | 100.0 | |
| Missing | missing | 6 | 13.3 | |
| Total | 45 | 100.0 |
So, 6 participants did not answer this question, so the total number of participants was not 45, but 39. Now the frequency is calculated using 39 participants.
If we look at how many participants searched for between 5-9 minutes we can see that 9 people searched for this length of time. If we want to look at that as a percentage of the sample, SPSS has calculated it as 9 ÷ 39 x 100 = 23.1%
![]()
![]()